Tip of the Week! Track Your Automation Maturity with Dashboards
You know you should be automating more tests, but do you actually know how much of your testing is automated vs. manual? Most teams can’t answer that question without manually counting tests. PractiTest dashboards let you visualize automation coverage in real-time—by sprint, release, or feature.
Automation Coverage Tracking
Build automation visibility in 3 steps:
Step 1: Create Custom Fields (Example)
To track automation status, you’ll need custom fields. Here’s one way to set this up:
In Test Library, create a custom field like:
- Field name: Automation Type
- Values: Manual, Planned for Automation, Automated
- Link this custom field to Tests
(This tracks which tests are still manual, which you plan to automate and which are already automated)
In Test Sets & Tests, create a custom field like:
- Field name: Execution Type
- Values: Manual, Automated
- Link this custom field to Test Sets
(This tracks which tests actually ran manually vs. automated)
(Adjust field names and values to match your team’s terminology—whatever makes sense for your process.)
Step 2: Tag Your Tests & Runs
As you create and execute tests, assign the appropriate automation status. Use Batch Edit to tag multiple tests or Test Sets at once.
Step 3: Add Dashboard Widgets
Create two widgets to visualize your automation landscape:
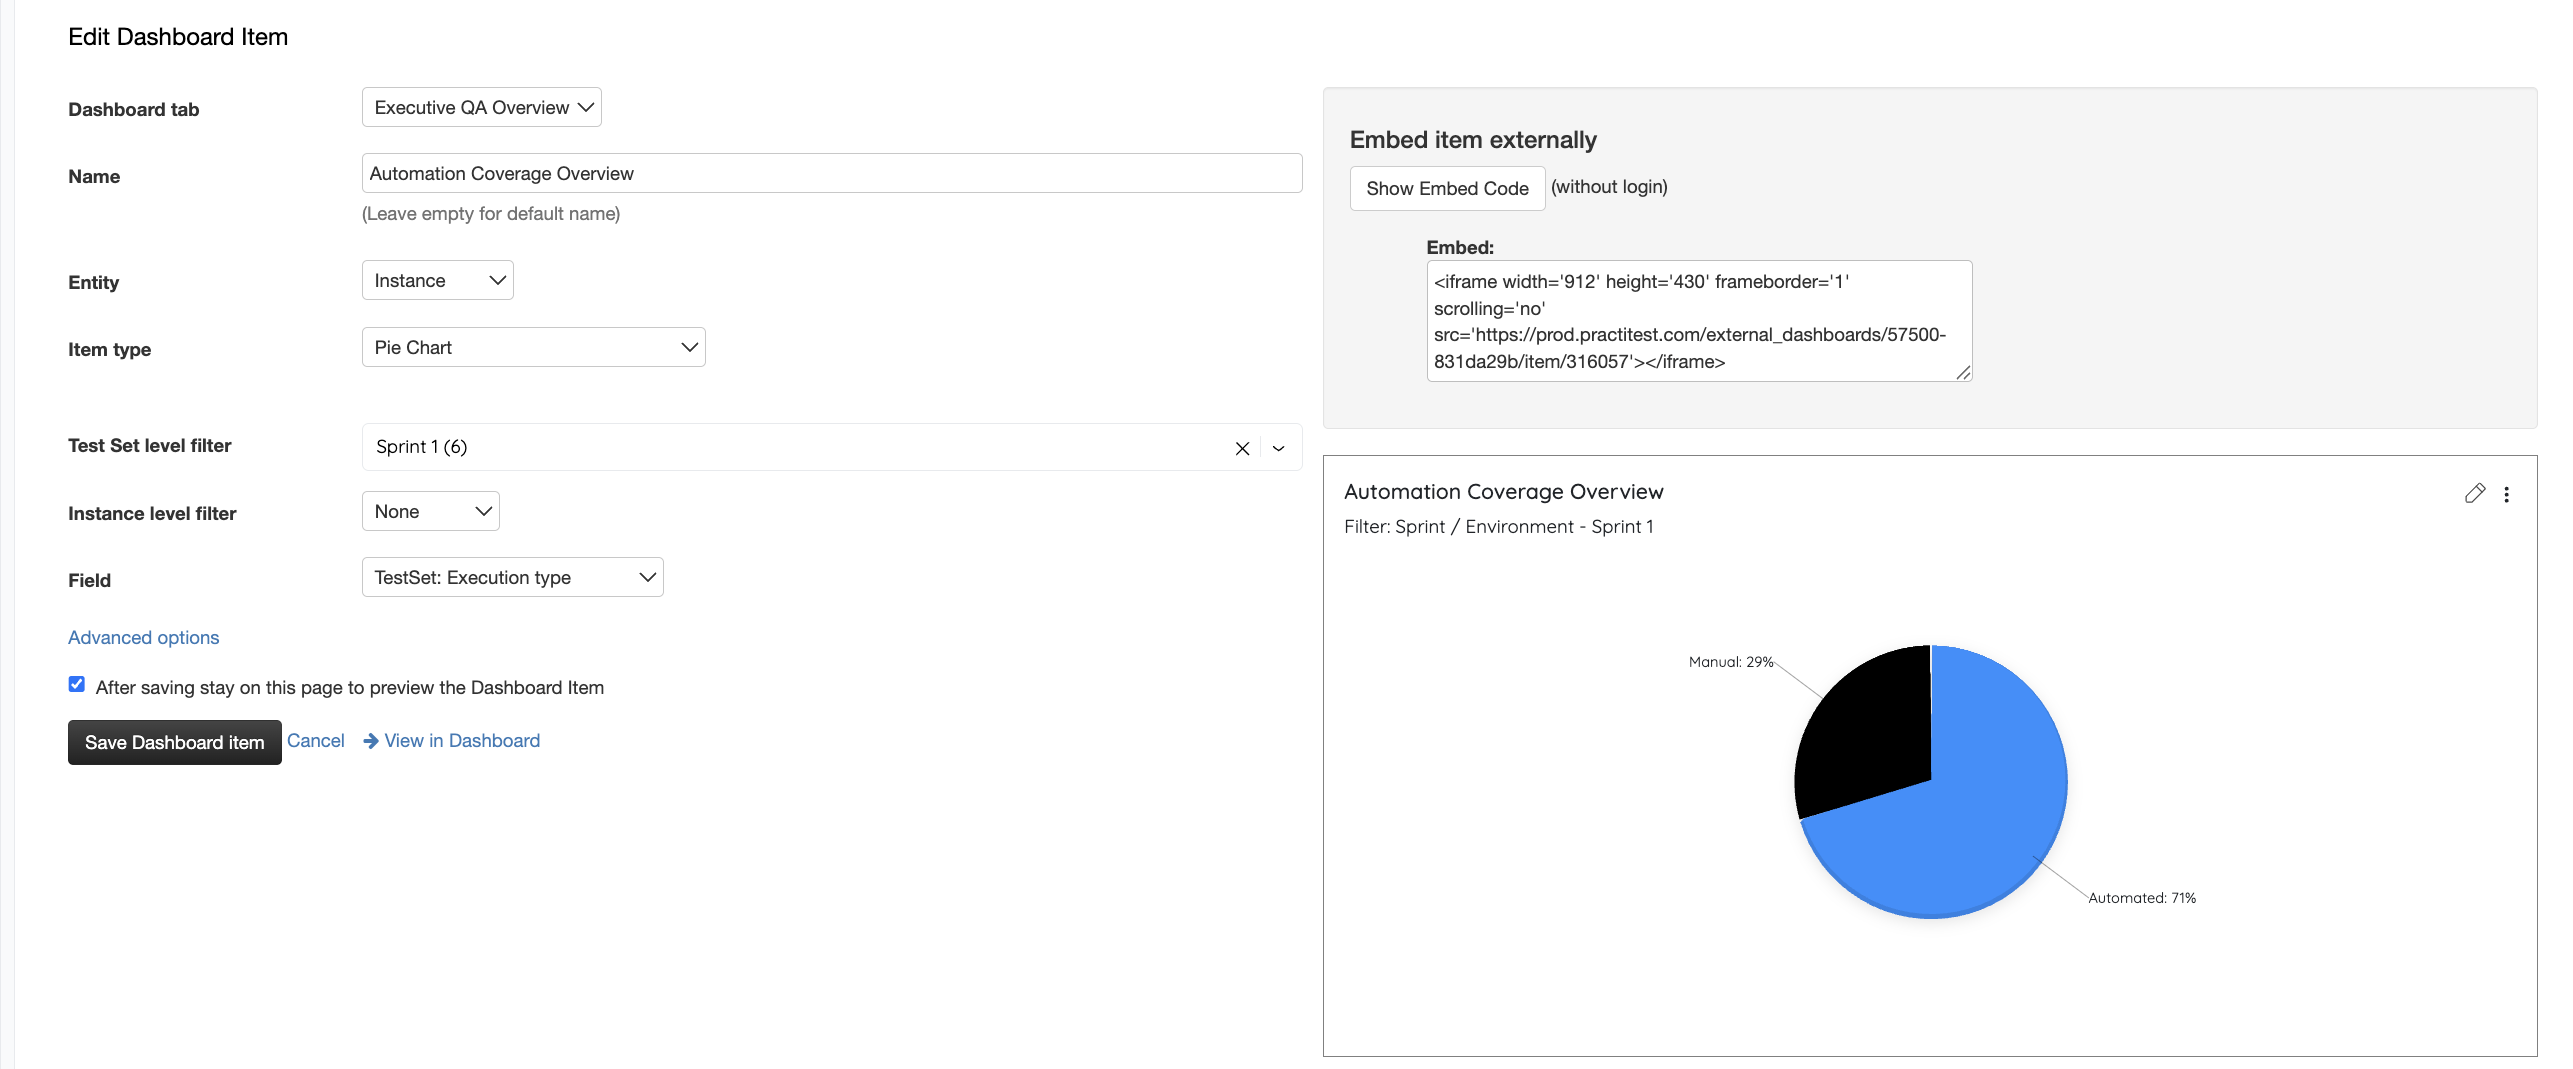
Widget 1: Automation Overview (Pie Chart)
- Shows the overall split: X% Automated, Y% Manual
- Drill down by sprint, release, or any other filter
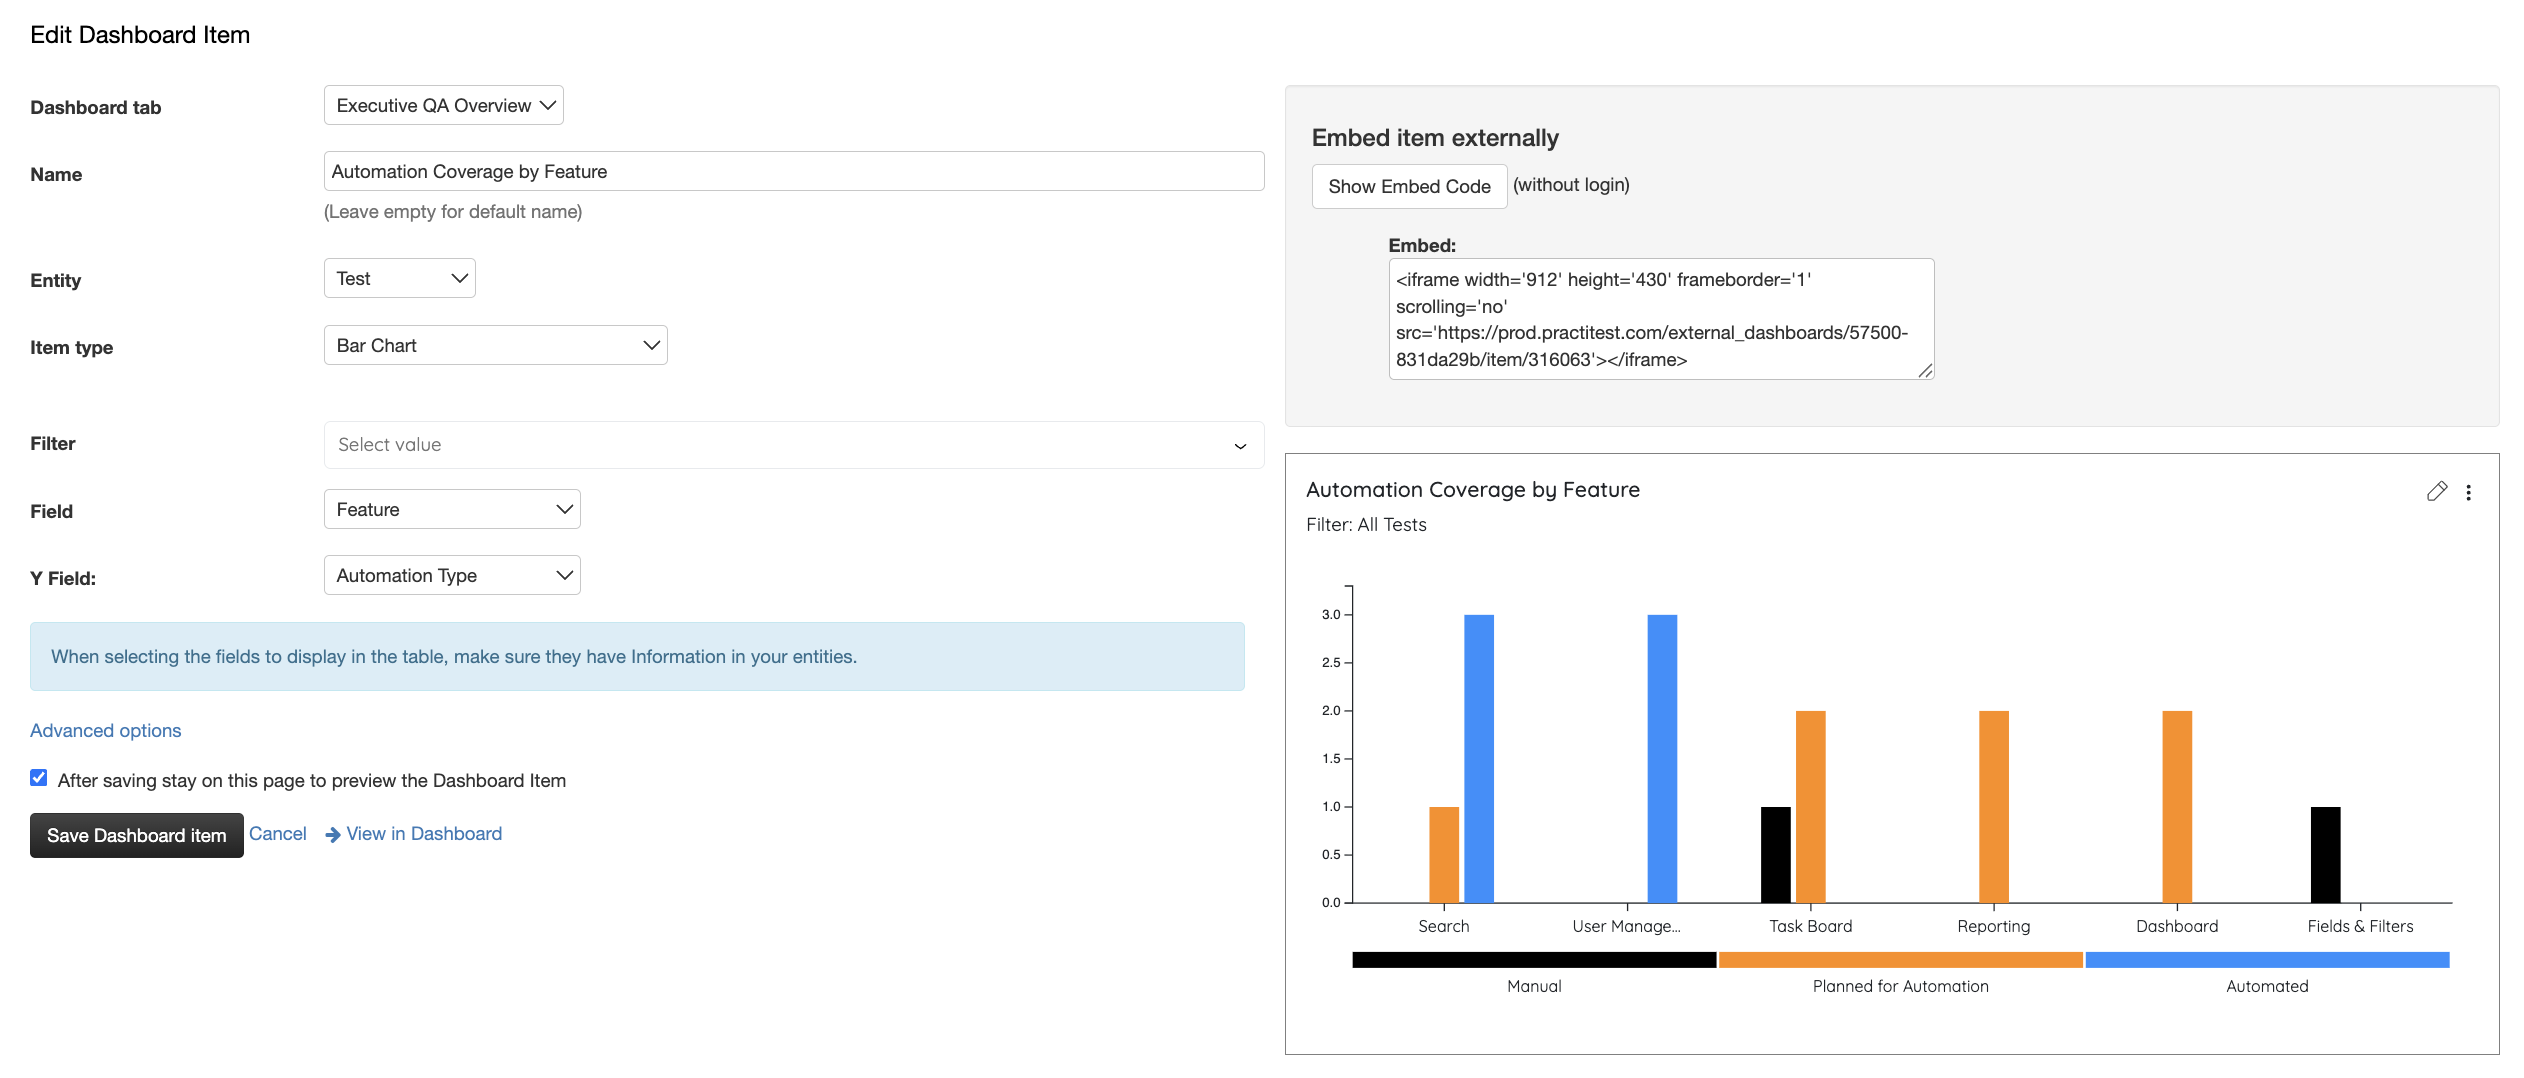
Widget 2: Automation Coverage by Feature (Bar Chart)
- Shows automation status broken down by Feature, Component, or Product
- Identifies which areas need more automation effort
Why This Matters
Know your automation baseline. Many teams discover they’re only 30% automated when they expect 60%. Data-driven automation strategy beats guesswork.
Identify gaps. A bar chart immediately shows which features lag in automation—focus your effort where it matters.
Track progress. Run the same dashboards month-to-month to prove you’re improving automation coverage. Great for team morale and stakeholder updates.
Plan smarter sprints. If Search is only 20% automated and Payment is 80%, you know where to invest automation effort next.
Real Example
See automation coverage split 47% Automated / 53% Manual across your project, then drill into each feature to find opportunities for improvement. Dashboard filters let you compare this by sprint, release, or team.
Next Steps
Start with the custom fields above, tag 2-3 sprints of tests, then set up your dashboard widgets. You’ll have instant visibility into your automation maturity.