Every QA team asks the same question: “What’s the status of our open defects?” But the answer looks different depending on who you are. A QA lead cares about blockers and trends. A tester needs to know what they’re assigned. A product manager wants to know if the release is ready.
Instead of one-size-fits-all defect reporting, build a customizable dashboard that answers your team’s specific questions.
Dashboard Widget Categories
Choose the widgets that matter most to your team:
Category 1: Health & Blockers For QA leads and release managers
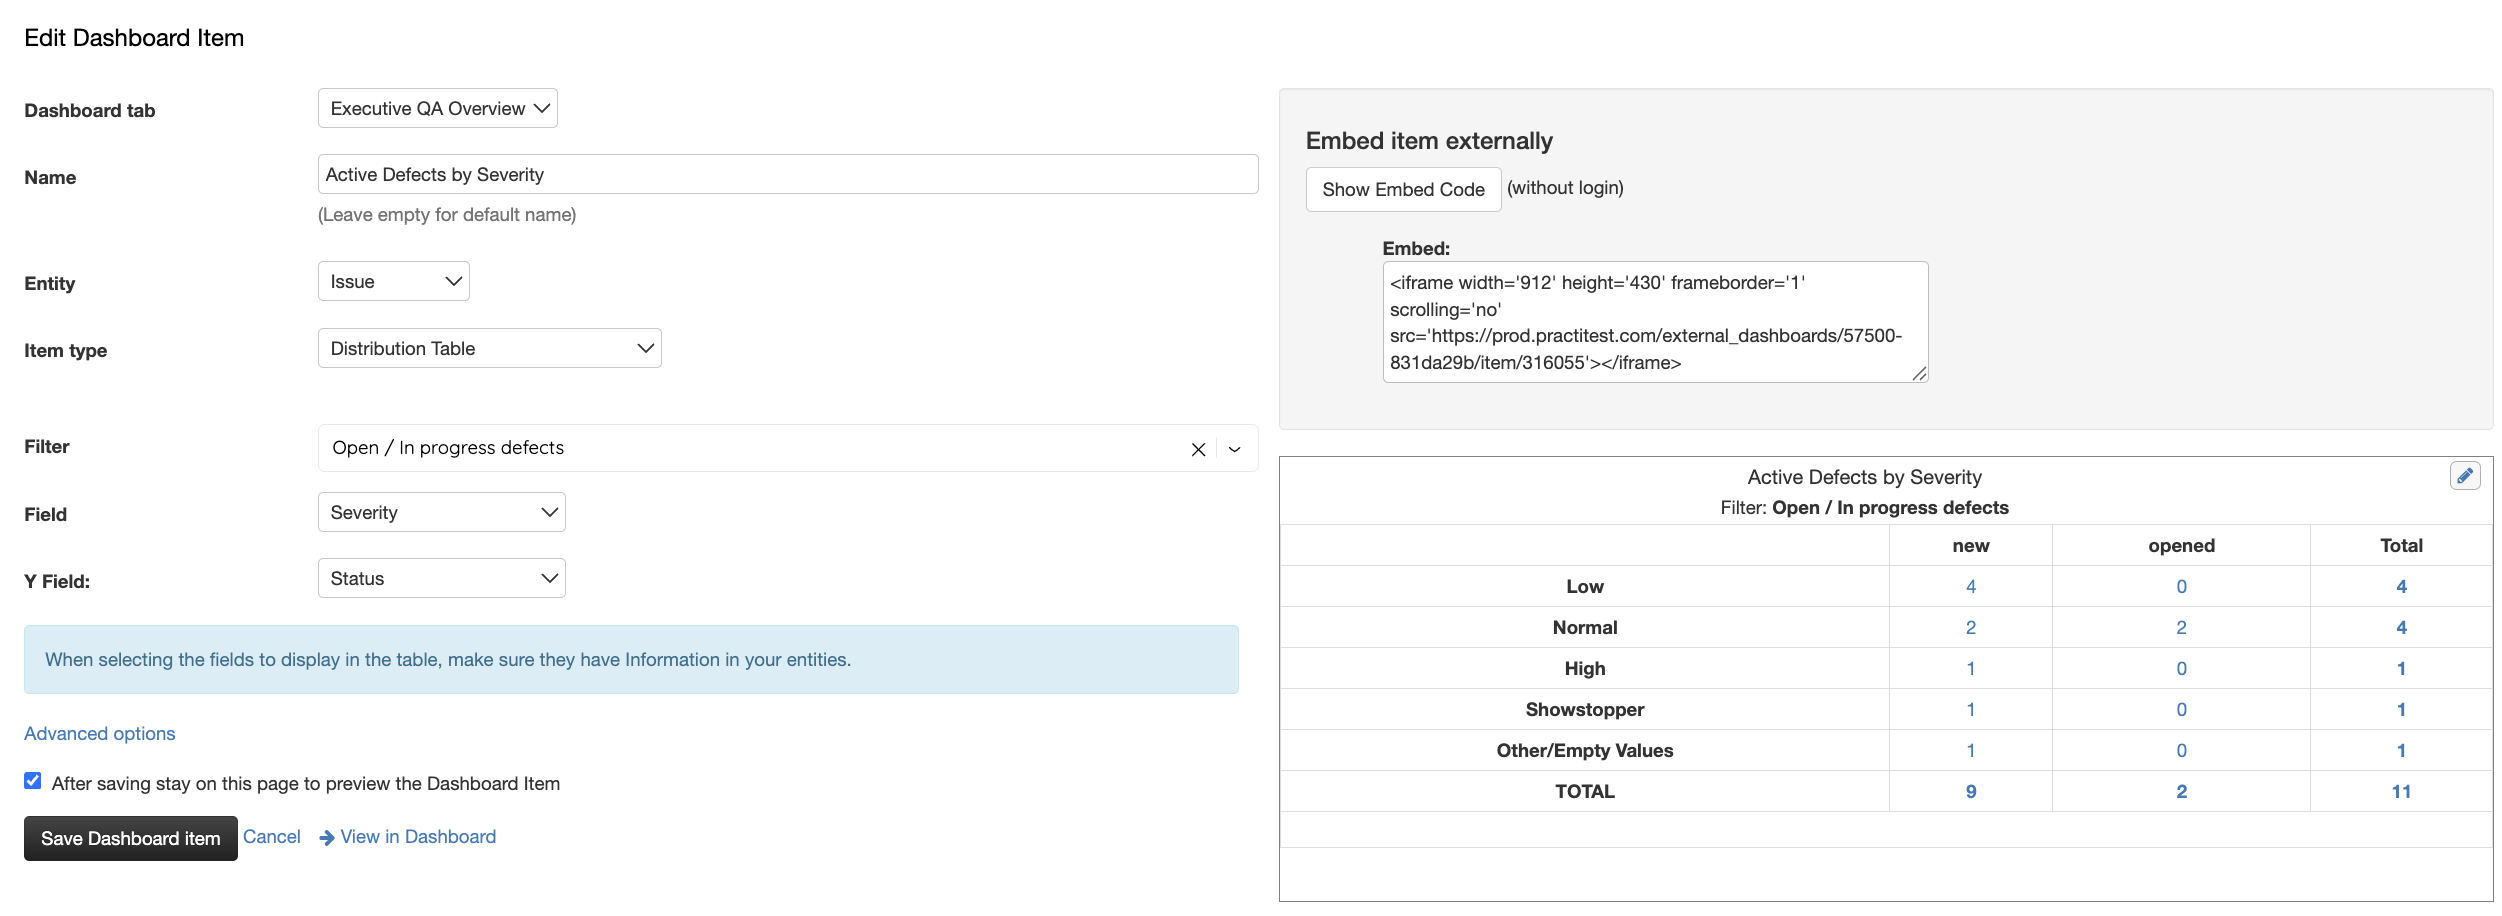
- Active Defects by Severity — Table showing open/in-progress defects broken down by priority (Critical, High, Medium, Low)
- Shows at a glance: How many show-stoppers do we have?
- Filter by: Sprint, Release, or status (Open / In Progress)
Category 2: Problem Areas For identifying quality trends
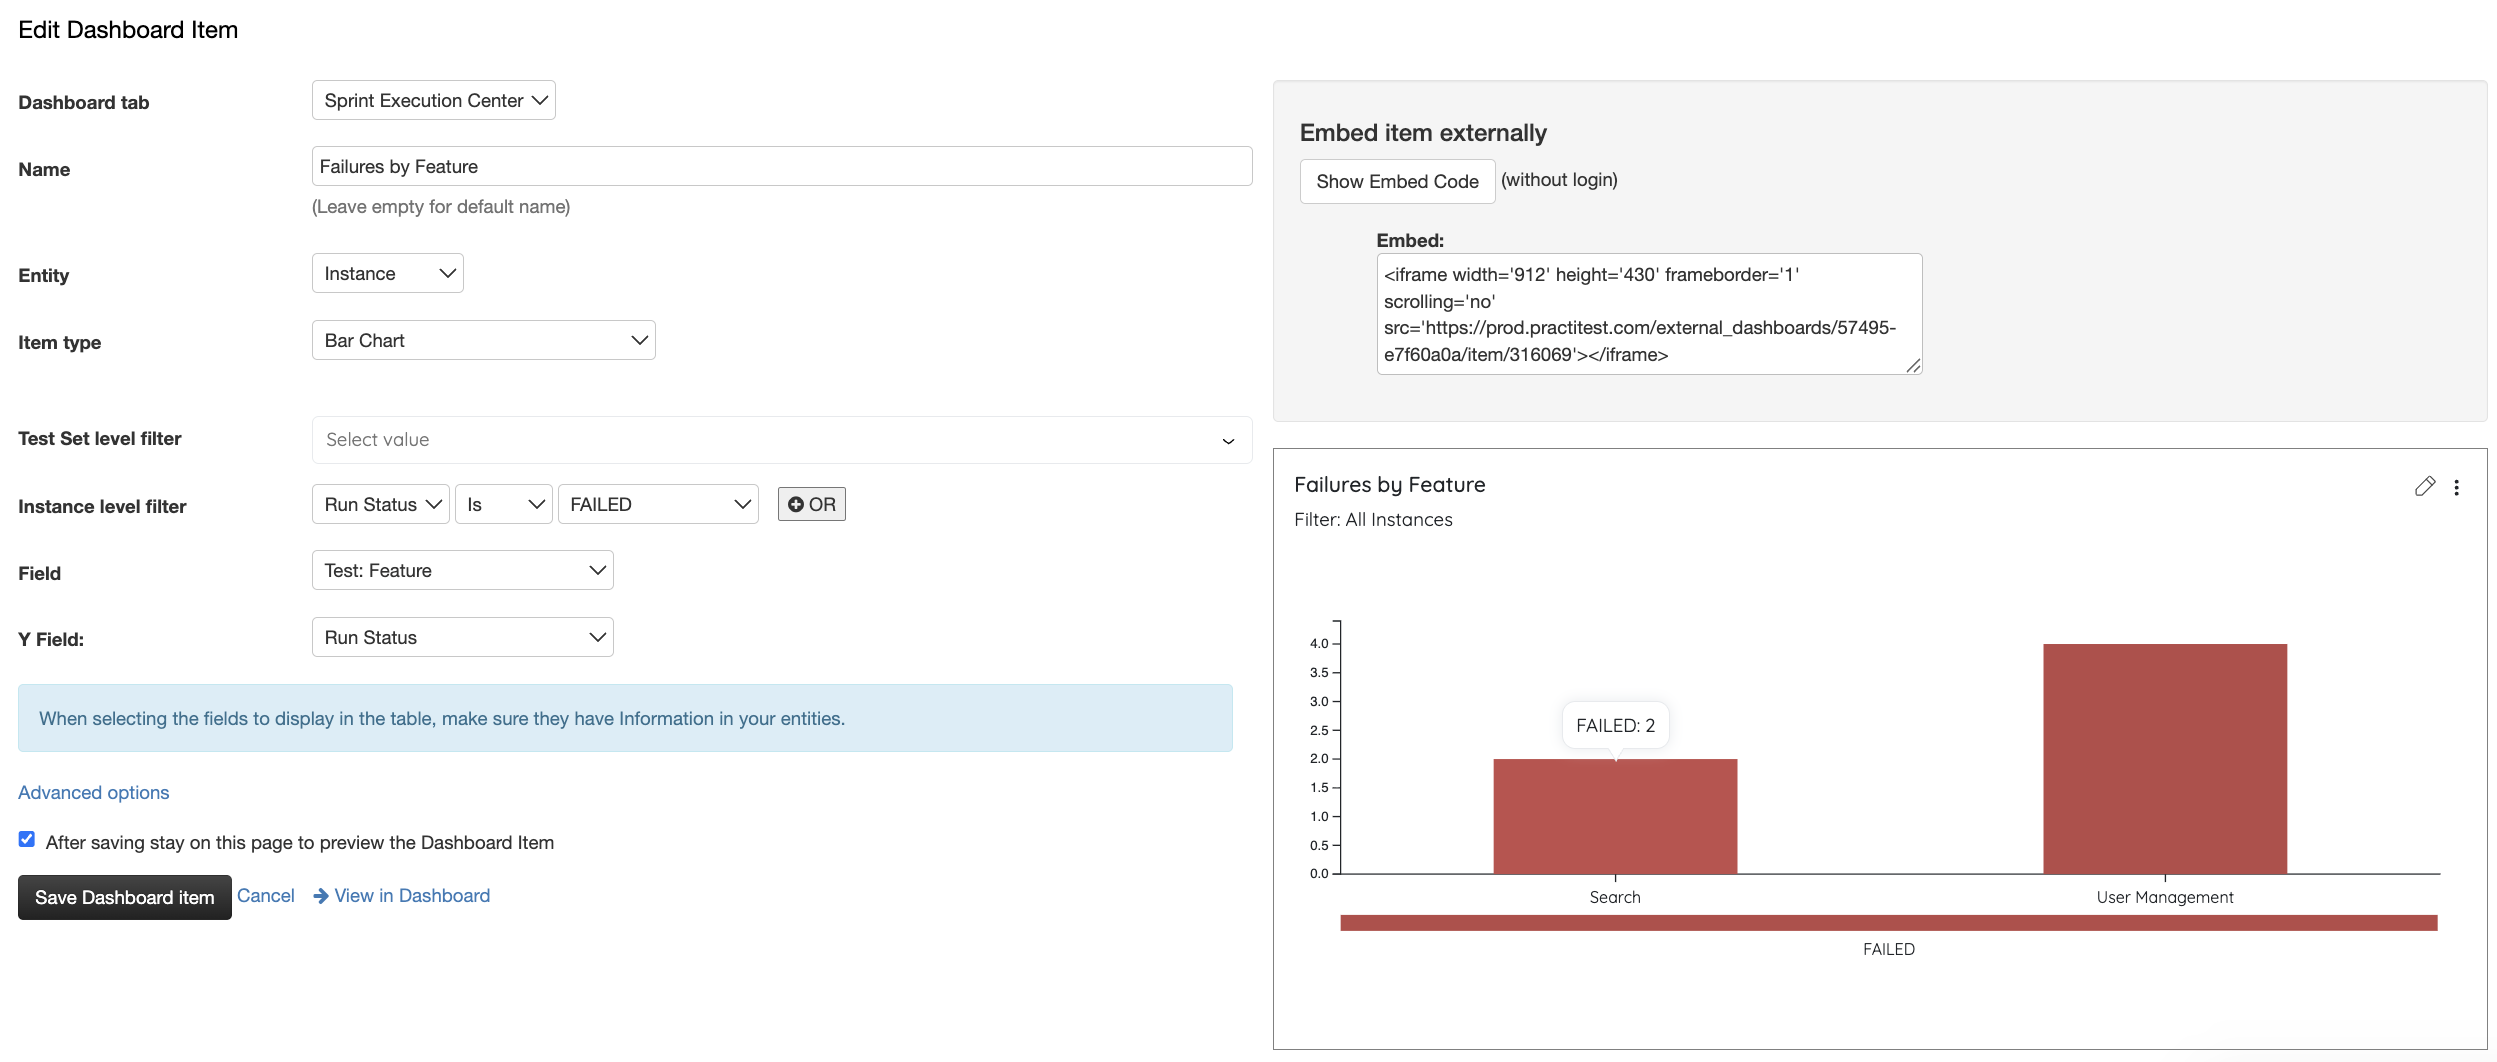
- Defects by Feature/Component — Bar chart showing which features have the most open defects
- Shows: Where are our quality issues concentrated?
- Helps prioritize future automation or test improvements
Category 3: Recent Activity For staying current
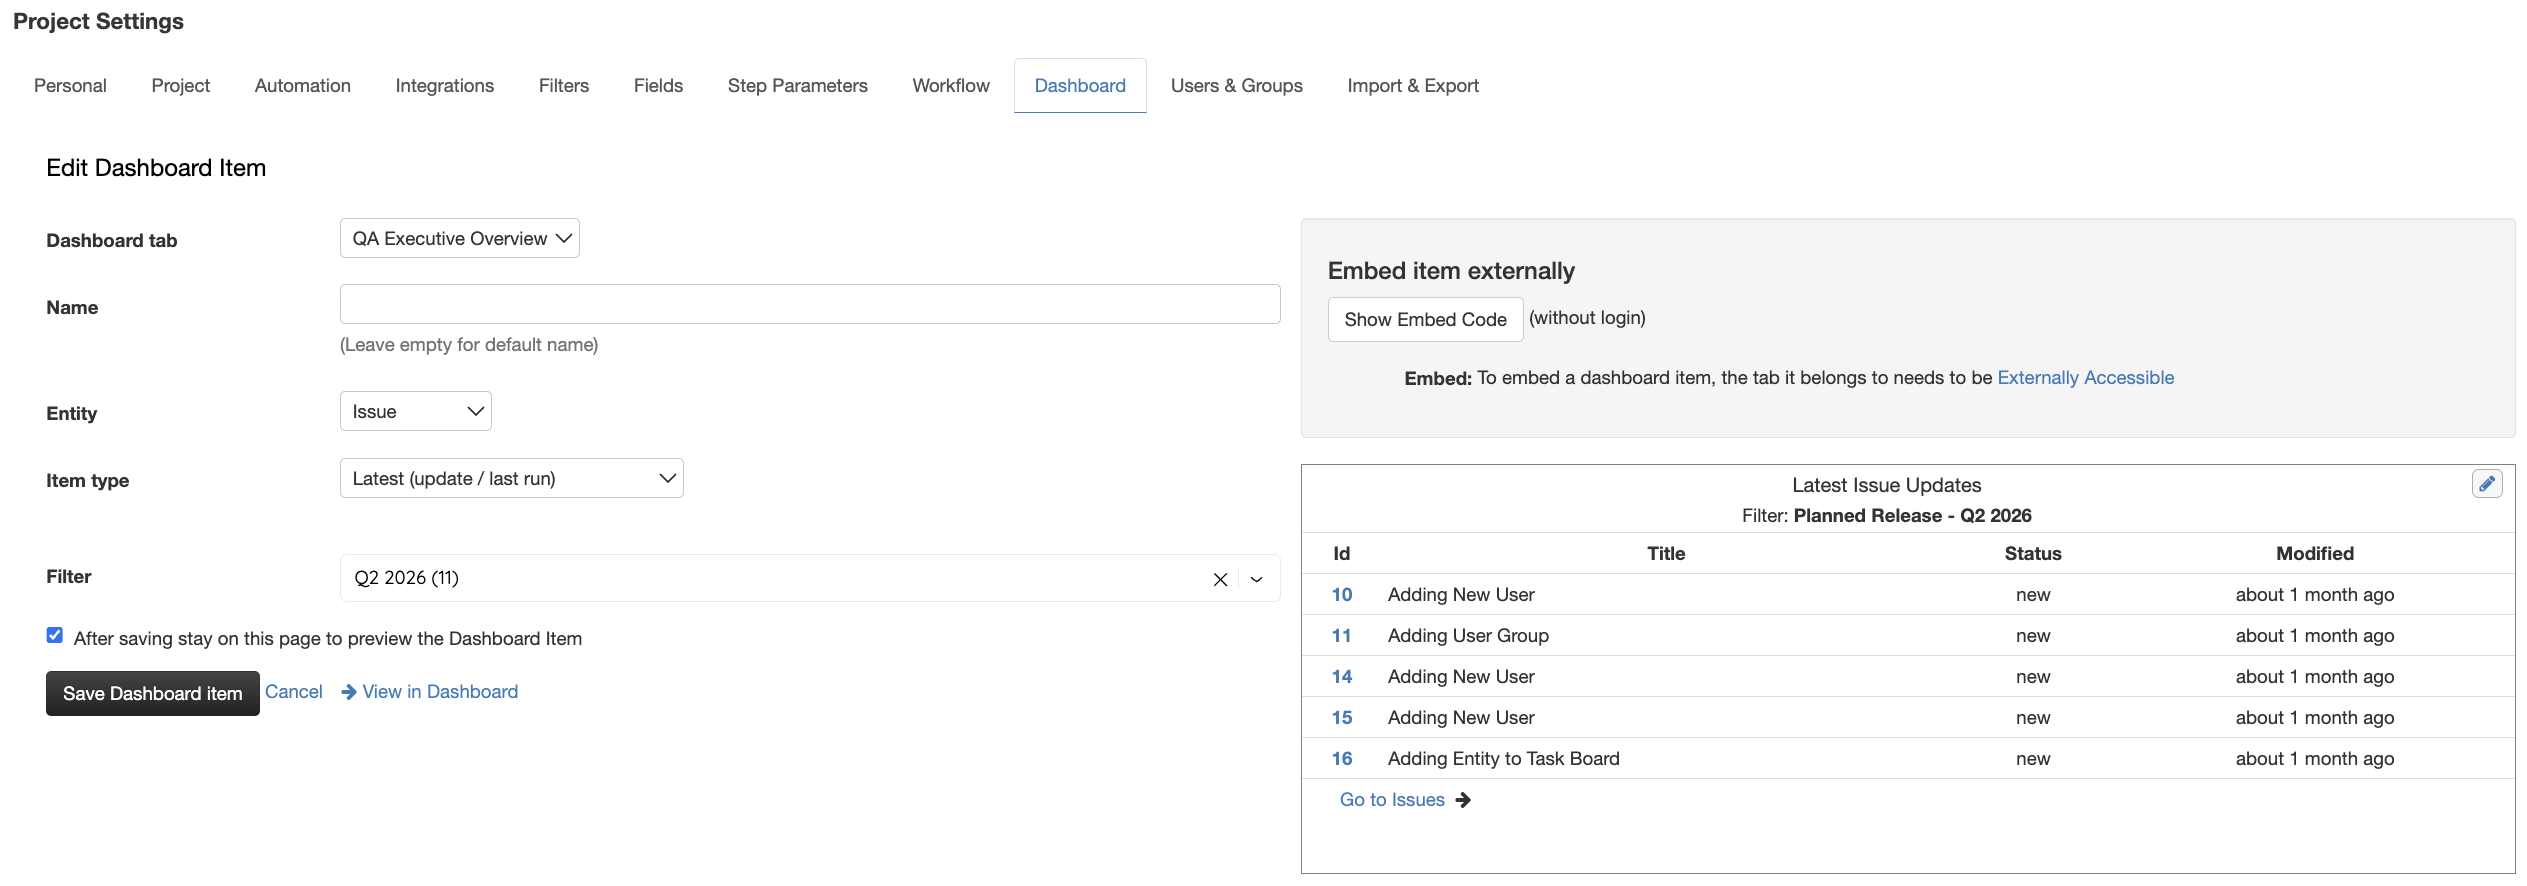
- Recently Created Defects — Table showing latest defects with: ID, Title, Priority, Assignee, Created Date
- Shows: What just came in that I need to know about?
- Filter by: Last 24 hours, last week, or by severity
Category 4: Workload (Optional) For capacity planning
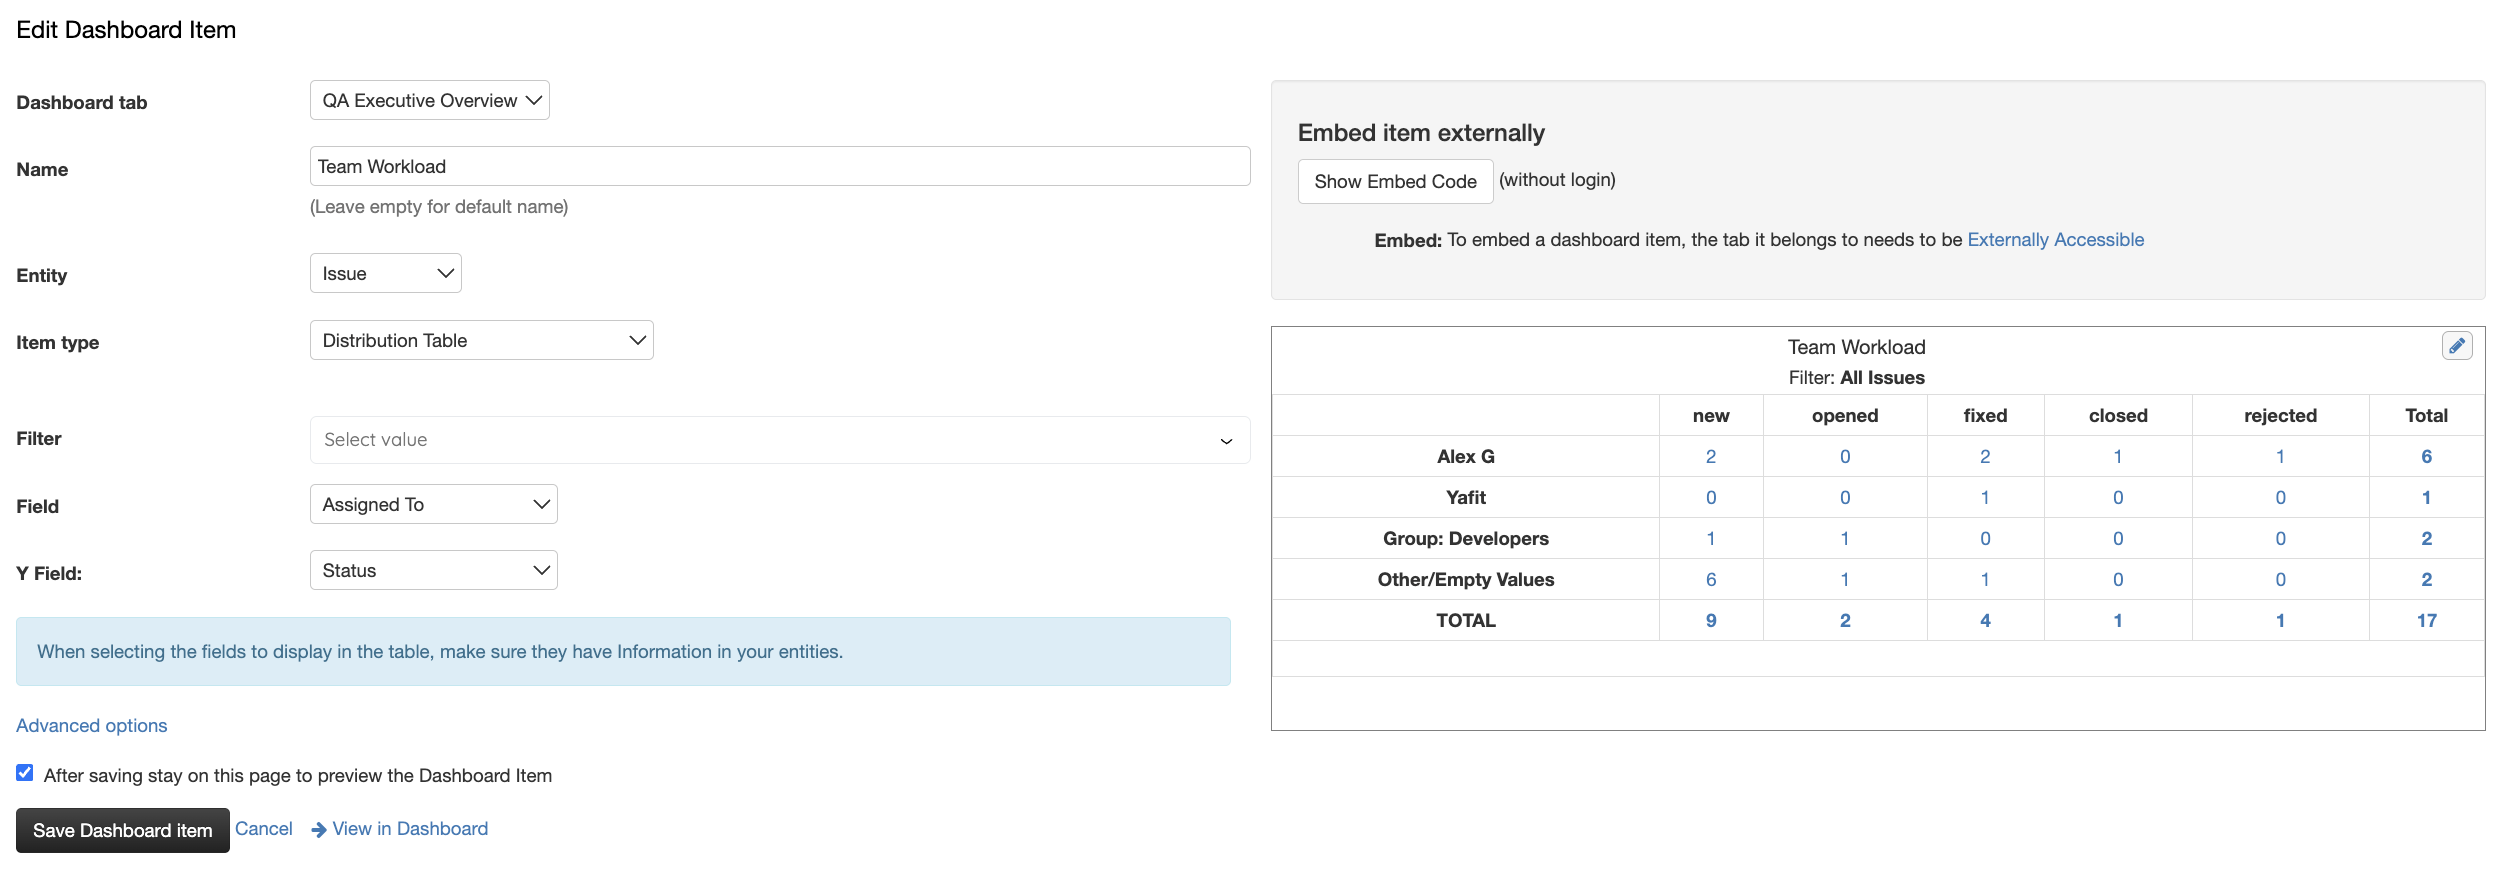
- Defects by Assignee — Bar chart showing defect distribution across team members
- Shows: Who’s carrying the heaviest load right now?
- Useful if your team rotates defect triage
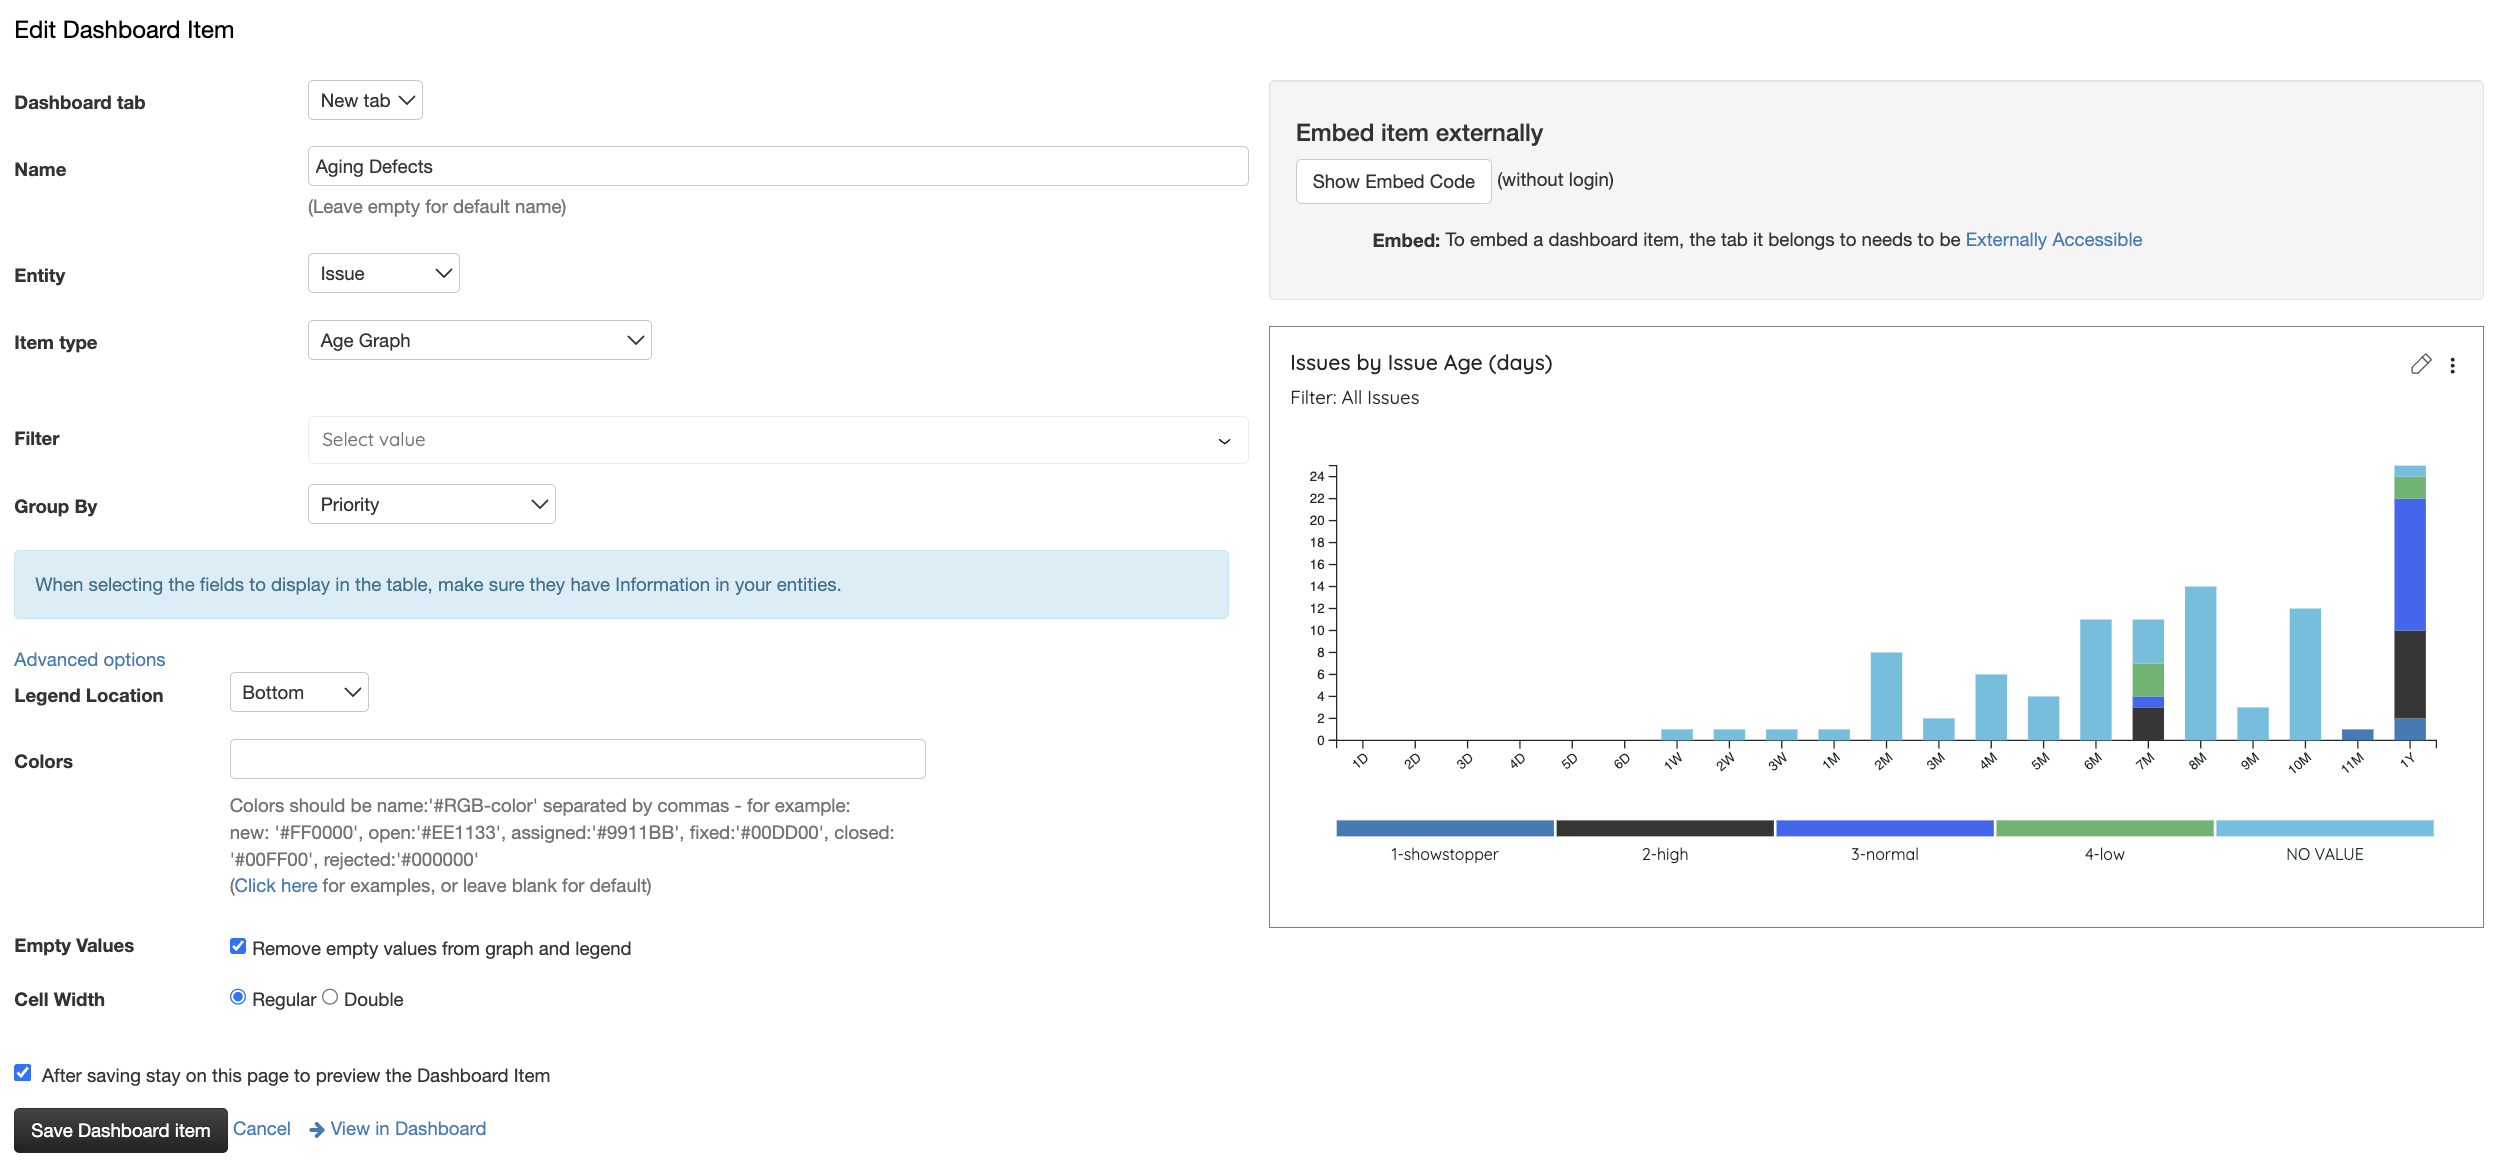
Category 5: Aging Defects (Optional) For identifying stuck items
- Defects Open > X Days — Counter card or table showing defects that haven’t moved in a while
- Shows: What’s stuck in the backlog?
- Filter by: Status, priority, assignee
Create Your Dashboard
Pick the widget categories that matter to your team and add them to a new dashboard. Apply filters by Sprint, Release, Feature, or Status to keep data relevant. You can create multiple dashboards for different roles—one for QA leads focused on blockers and trends, another for testers focused on what’s assigned to them.
![]() Step-by-step guide in our Help Center
Step-by-step guide in our Help Center
Why This Matters
Defect dashboards turn scattered information into actionable intelligence. Instead of hunting through lists, your team sees what matters—whether that’s blockers, problem areas, or aging items. Data-driven defect management gets issues closed faster and gives stakeholders confidence in quality.