Tabular Aggregated Report
(Available for Test Instances and Test Runs)
The Tabular Aggregated report can be created for 2 purposes:
-
Compare aggregated results of the same instances over different runs. For example, compare specific instances after you run it in different operating systems or devices. This will allow you to see how many times the same instances Passed or Failed under any operating system or device.
-
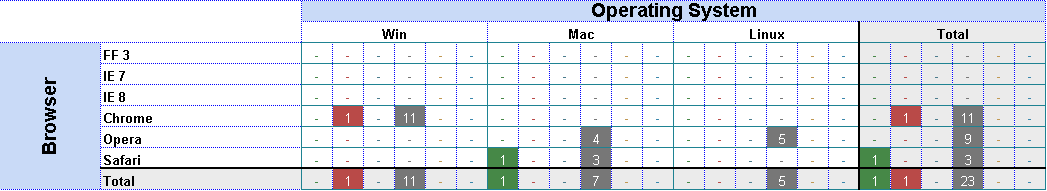
Analyze instances or runs aggregated results based on different parameters. For example, aggregated instances results, based on versions vs. operating system. This will allow you to check the stability of a specific version while running on each operating system. The instances that are aggregated can be of the same Test or different Tests (depending on how you build your Test Set).
There are 2 preconditions to get this Report:
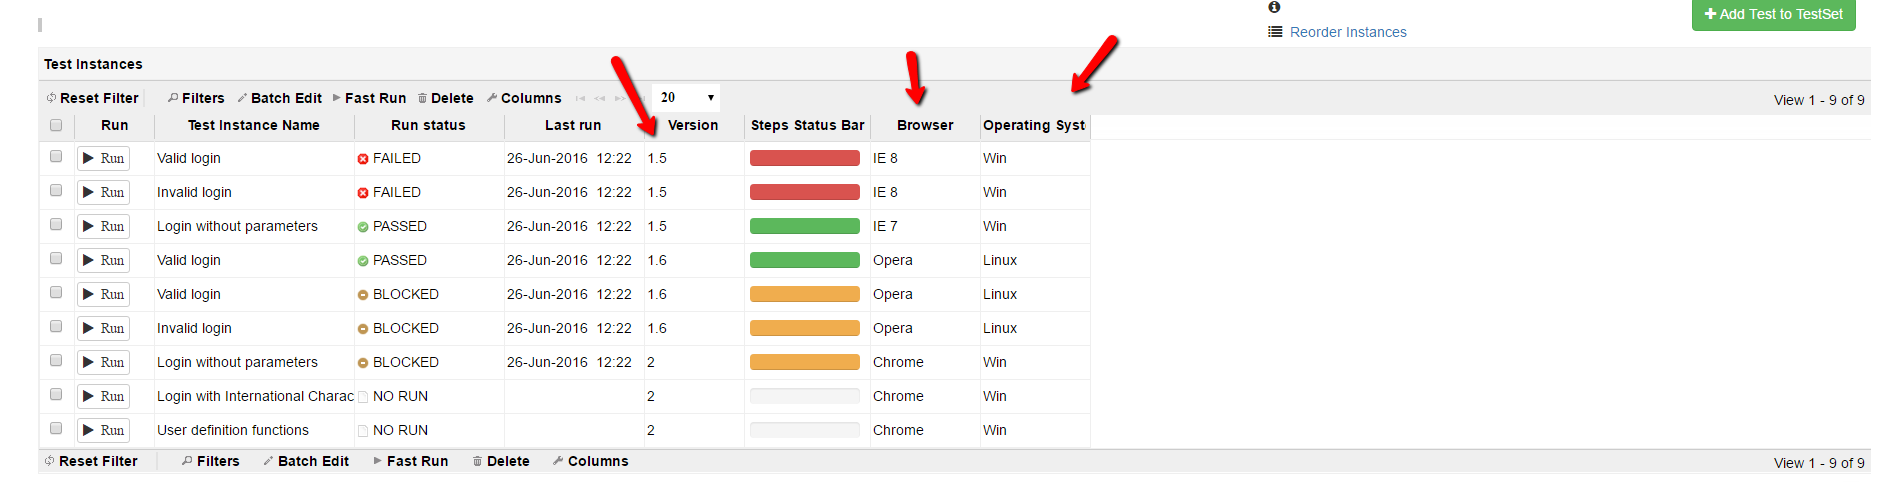
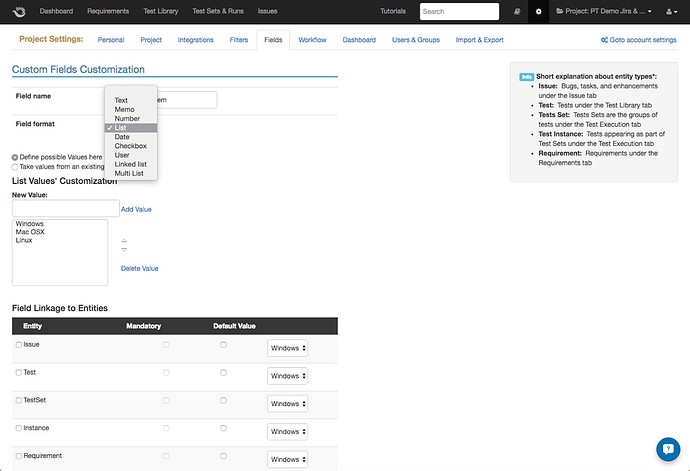
- You need to have the custom fields that you like to analyze in the report within your instances or runs custom fields, depending on the selected entity (this is easy to do if you use the Batch Edit button). Please see the image below.
- Your custom fields format must be of the type: List or Linked List
Custom fields’ types for the tabular aggregated report.
Note: see the new addition to the tabular aggregated report
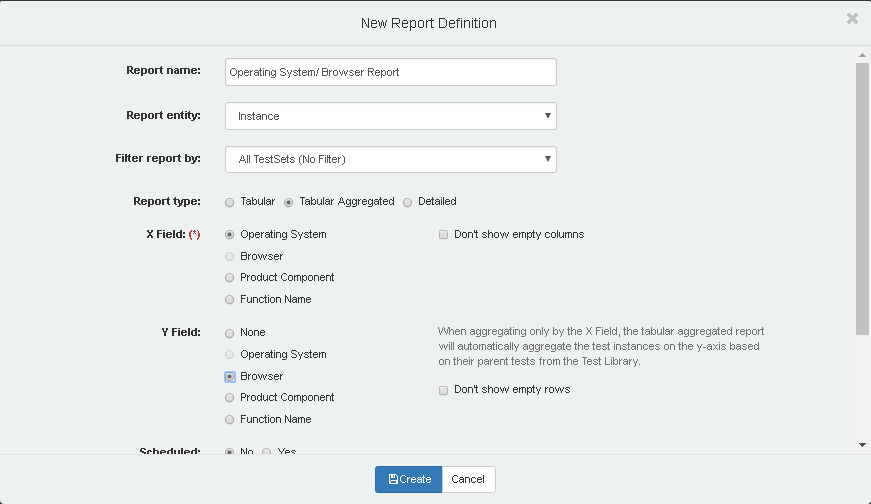
When you create a Tabular Aggregated Report you have two options:
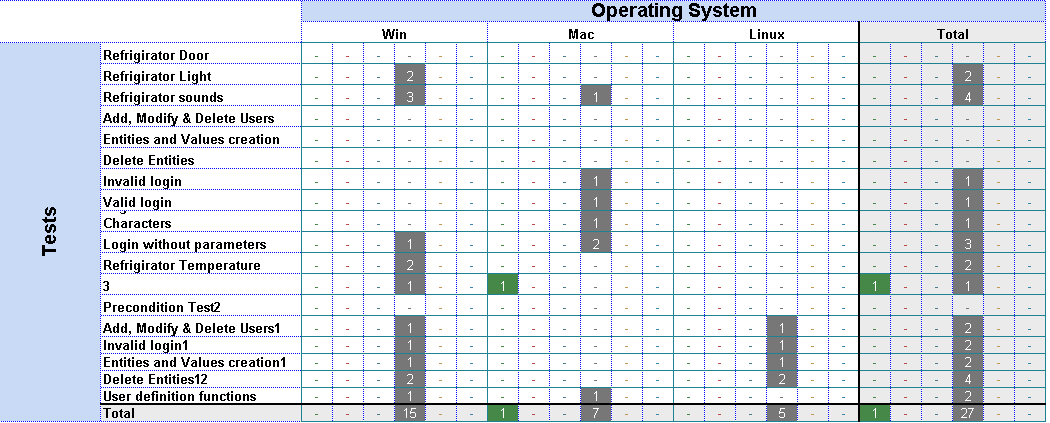
- You can create a report choosing X Field only. Thus the tabular aggregated report will automatically aggregate the test instances or runs on the y-axis based on their parent tests from the Test Library.
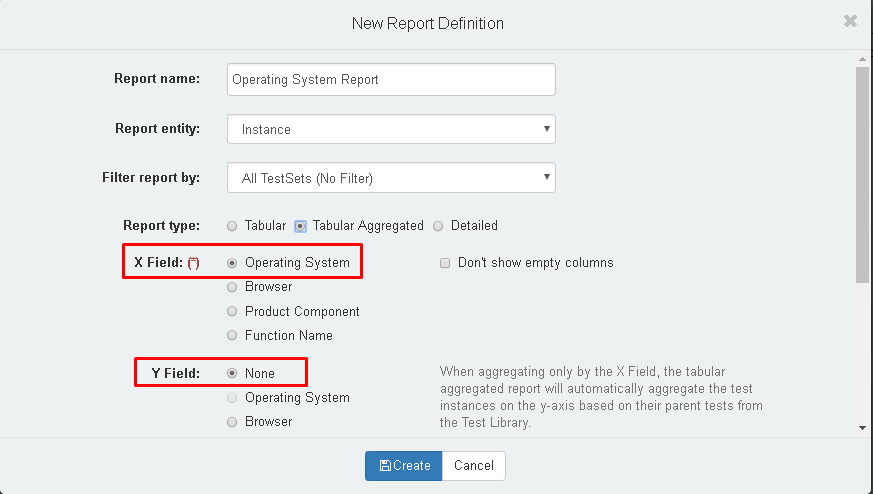
2.You can choose both X Field and Y Field, hence the report will aggregate the test instances or runs based on these two fields.